Editor’s Note: The data in this article was pulled from the Townsend Harris Naviance Portal as of October 2020 and has been verified.
Senior year is the time when students have the opportunity to take more electives that reflect their personal and intellectual interests, not only at Townsend Harris but also through the Queens College (QC) Bridge Program. While seniors have long shared and compared their schedules with each other, neither the school nor The Classic has, in recent memory, released a numerical breakdown of the senior class schedules by category (such as STEM and humanities) or course enrollment.
As a first, this article presents the data available as of October 2020. For the Class of 2021, the schedules of 291 seniors reveal the interests of students in a school that emphasizes its “Intensive Academic Humanities” curriculum.
While seniors are enrolled in both humanities and STEM courses at Townsend, the numbers for STEM enrollment are much higher. However, the same is not true in the QC program where Townsend seniors are taking more humanities than STEM courses.
To protect students’ privacy, this article does not identify the names of any students with their schedules.
Elective AP courses
By subject area, Townsend Harris offered a total of 15 elective AP courses for the 2020-21 year. STEM courses make up 53% (8 out of 15) while those in the humanities round out the remaining 47% (7 out of 15).
In terms of enrollment, the top-5 elective AP courses among seniors are all STEM courses. In the top-10 elective AP courses, 8 are STEM-related. AP Calculus BC has the highest enrollment (99) of any elective AP course at THHS.
When asked about how he chose his classes, senior Itamar Hindi said, “Generally I’d say I that went for APs that were more towards STEM because math is one of the subjects I’m more passionate about … [this] led me to take Computer Science A, Calculus BC, and Macroeconomics because those all have a … correlation to math in general.”
Total senior enrollment for all AP courses (both humanities and STEM) stands at 448 students. This number is greater than the total number of seniors, 291, because many seniors are taking more than one AP course.
The following is a breakdown of enrollment in all elective AP courses. Note that AP U.S. Government and Politics and AP Macroeconomics, which have the largest enrollment (at 189 students) of any AP course among the senior class, was not included in this analysis because it is a required course.
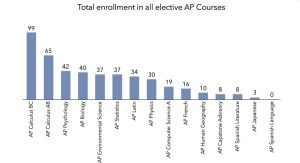
A breakdown of the seniors’ elective AP courses by subject area (see LISTS A and B below) reveals that the cumulative enrollment for STEM courses (369) far exceeds the one for humanities (79).
LIST A: Elective AP STEM courses
99 – AP CALCULUS BC
65 – AP CALCULUS AB
42 – AP PSYCHOLOGY
40 – AP BIOLOGY
37 – AP ENVIRONMENTAL SCIENCE
37 – AP STATISTICS
30 – AP PHYSICS
19 – AP COMPUTER SCIENCE A
369 (Total)
LIST B: Elective AP humanities courses
34 – AP LATIN
16 – AP FRENCH
10 – AP HUMAN GEOGRAPHY
8 – AP CAPSTONE ADVISORY
8 – AP SPANISH LITERATURE
3 – AP JAPANESE
0 – AP SPANISH LANGUAGE
79 (Total)
A further breakdown of the 291 senior schedules in the following graph shows that around 40% of seniors are taking 2 elective AP courses, which was the most popular among seniors. Nearly 70% are taking between 2-3 elective AP courses.
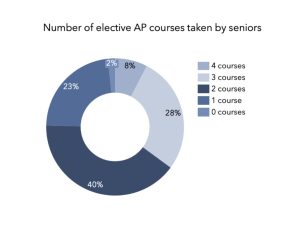
A closer look also reveals how each student splits their elective AP courses between STEM and the humanities. (See LISTS C – F below.)
LIST C: Of the 22 students taking 4 elective AP courses:
- 73% (or 16 students) split them evenly between 2 STEM and 2 humanities courses.
- 14% (3 students) are taking 3 STEM courses and 1 humanities course.
- 9% (2 students) are taking 1 STEM course and 3 humanities courses.
- 4% (or 1 student) is taking no STEM courses and 4 humanities courses.
LIST D: Of the 80 students taking 3 elective AP courses:
- 78% (or 63 students) are taking 2 STEM courses and 1 humanities course.
- 15% (or 12 students) are taking 1 STEM course and 2 humanities courses.
- 4% (or 3 students) are taking 3 STEM courses and 0 humanities courses.
- 3% (or 2 students) are taking 0 STEM courses and 3 humanities courses.
LIST E: Of the 117 students taking 2 elective AP courses:
- 62% (or 73 students) split them evenly between 1 STEM and 1 humanities course.
- 31% (or 36 students) are taking 2 STEM courses and 0 humanities course.
- 7% (or 8 students) are taking 0 STEM courses and 2 humanities courses.
LIST F: Of the 67 students taking 1 elective AP course:
- 37% (or 25 students) are taking a STEM course.
- 63% (or 42 students) are taking a humanities course.
Non-AP elective STEM courses
For non-AP elective STEM courses, LIST G below shows the number of seniors in each class in descending numerical order.
LIST G: Number of non-AP elective STEM courses taken by seniors
15 – SCIENCE RESEARCH
12 – ANATOMY & PHYSIOLOGY
12 – PRE-CALCULUS
11 – BIOMEDICAL ETHICS
10 – COMPUTER ASSISTED DESIGN ROBOTICS
7 – ELECTRONICS & MECHANICS OF ROBOT BUILD
7 – PRINCIPLES OF ENGINEERING
3 – EARTH SCIENCE
2 – ADVANCED ALGEBRA
1 – ALGEBRA 2 TRIGONOMETRY
Non-AP elective humanities and physical education courses
For non-AP elective humanities and physical education courses, LISTS H – L below show the number of seniors in each class in descending numerical order in five categories.
LIST H: The Arts
11 – YEARBOOK
10 – MULTIMEDIA JOURNALISM
9 – ADVANCED MULTIMEDIA JOURNALISM
8 – THEATRICAL EXPRESSIONS
7 – PHOTOGRAPHY
7 – QUEER LITERATURE
LIST I: Foreign Languages
5 – H FRENCH TERM 1
4 – LATIN TERM 3
4 – SPANISH CONVERSATION 1
1 – JAPANESE TERM 3
1 – CLASSICAL GREEK TERM 3
1 – SPANISH TERM 5
LIST J: Music
12 – SYMPHONIC ORCHESTRA
9 – JAZZ BAND
6 – ADVANCED STRING ENSEMBLE
6 – MUSIC TECHNOLOGY
6 – PERFORMANCE ORCH
5 – BEGINNING STRINGS
5 – WIND ENSEMBLE
2 – CONCERT BAND
2 – PIANO
LIST K: Physical Education
82 – FITNESS & STR TRAINING
62 – FITNESS
43 – AEROBICS
40 – TENNIS
20 – YOGA
17 – VOLLEYBALL
13 – SOCCER & BADMINTON
11 – 11TH &12TH TEAM SPORTS
9 – HEALTH
LIST L: Student Government & Leadership
42 – SENIOR COUNCIL
8 – SU EXECUTIVE BOARD
3 – STUDENT LEADERSHIP
Courses at Queens College
All 291 seniors are enrolled in a required Humanities Seminar at Queens College (QC) which is taught jointly by a QC professor and a THHS faculty member. Seniors also enroll in two three-credit QC courses (one per semester) in line with their academic or personal interests. Some QC courses are asynchronous while others are synchronous and meet either once or twice a week (for a total of between 150-170 minutes every week). The inclusion of QC classes in senior programs explains why THHS gives them more time in their schedules.
For the elective QC course, LIST M shows the number of seniors in each of the following classes. Anthropology has the highest enrollment at 115 students. When asked about the rationale behind taking anthropology, senior Katie Hsu said, “I took Intro to Human Evolution (ANTH 102) with Professor Felicia Madimenos because the course aligned well with my interests and intended field of study. By analyzing not only genetics but also primate and human biological fossil variations, anthropology offers a valuable interdisciplinary approach that combines human behavior with cultural and biological context. This would especially appeal to seniors who want to pursue a career in the physical sciences.”
LIST M: Fall QC enrollment (in all courses, with 3 seniors not enrolled in a second QC course)
115 – ANTHROPOLOGY
37 – PHILOSOPHY
32 – ECONOMICS
26 – POLITICAL SCIENCE
13 – ENVIRONMENTAL SCIENCE
11 – MATH
7 – LINGUISTICS & COMM. DISORDERS
6 – URBAN STUDIES
5 – ACCOUNTING
5 – ASTRONOMY
4 – HISTORY
3 – ARTS
3 – FITNESS & NUTRITION SCIENCE
3 – SOCIOLOGY
2 – BIOLOGY
2 – DRAMA
2 – FRENCH
2 – GEOLOGY
2 – GERMAN
2 – MUSIC
2 – PHYSICS
1 – AFRICAN CIVILIZATION
1 – KOREAN
1 – MEDIA STUDIES
1 – PSYCHOLOGY
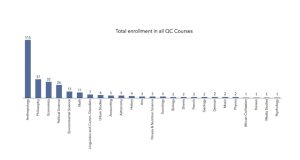
When broken down into QC math & science courses and QC humanities and social science courses (see the lists below), LIST N shows that Townsend seniors overwhelmingly preferred the humanities (with 244 students) compared to LIST O which shows the enrollment for math and science (with 44 students).
LIST N: QC enrollment (in humanities & social science courses)
115 – ANTHROPOLOGY
37 – PHILOSOPHY
32 – ECONOMICS
26 – POLITICAL SCIENCE
7 – LINGUISTICS & COMM. DISORDERS
6 – URBAN STUDIES
4 – HISTORY
3 – ARTS
3 – SOCIOLOGY
2 – DRAMA
2 – FRENCH
2 – GERMAN
2 – MUSIC
1 – AFRICAN CIVILIZATION
1 – KOREAN
1 – MEDIA STUDIES
TOTAL: 244
LIST O: QC enrollment (in math & science courses)
13 – ENVIRONMENTAL SCIENCE
11 – MATH
5 – ACCOUNTING
5 – ASTRONOMY
3 – FITNESS & NUTRITION SCIENCE
2 – BIOLOGY
2 – GEOLOGY
2 – PHYSICS
1 – PSYCHOLOGY
TOTAL: 44
This data shows a significant disparity in enrollment between the number of students in THHS STEM courses and in QC STEM courses, particularly in the biology departments. For example, the number of students who try to enroll in AP Biology every year at Townsend Harris far exceeds the number of spaces available in that course which was capped at 40 students this year. In contrast, the Intro to College Biology course at Queens College in Fall 2020 had 17 sections, 4 of which took place at a time which did not conflict with the Townsend schedule.
But an analysis of the seniors’ schedules reveals that only two Townsend students were enrolled in the Intro to College Biology course at Queens College during the Fall 2020 semester. Even though course availability for QC Biology was greater than AP Biology, students who were unable to get into the highly-sought AP Biology course largely did not choose to enroll in QC Biology as a substitute.
