


At Townsend Harris, academic performance can sometimes feel publicly visible, but is especially so through math participation charts. The math participation chart system at THHS encourages competition between students and reduces participation to a public numerical record rather than genuine learning.
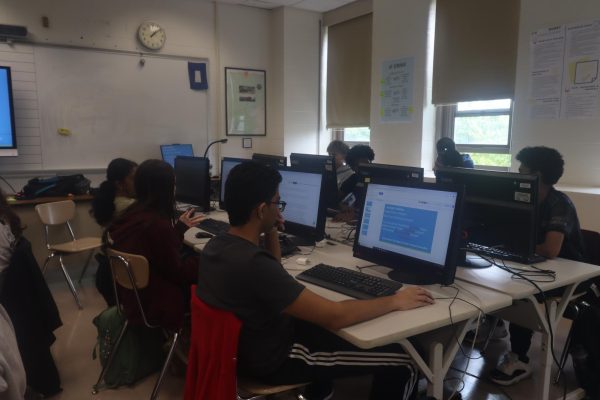
These charts are placed at the front of some math classrooms that I have been in. They display every student’s name alongside how many times they have participated. After answering a question, students record the date next to their names. These charts are factored into the participation grades of each student.
Because students can compare how frequently their peers contribute, participating can become driven by social pressure rather than genuine intellectual curiosity. Instead of being encouraged to ask complex questions, students are simply participating because they need to put marks on a paper.
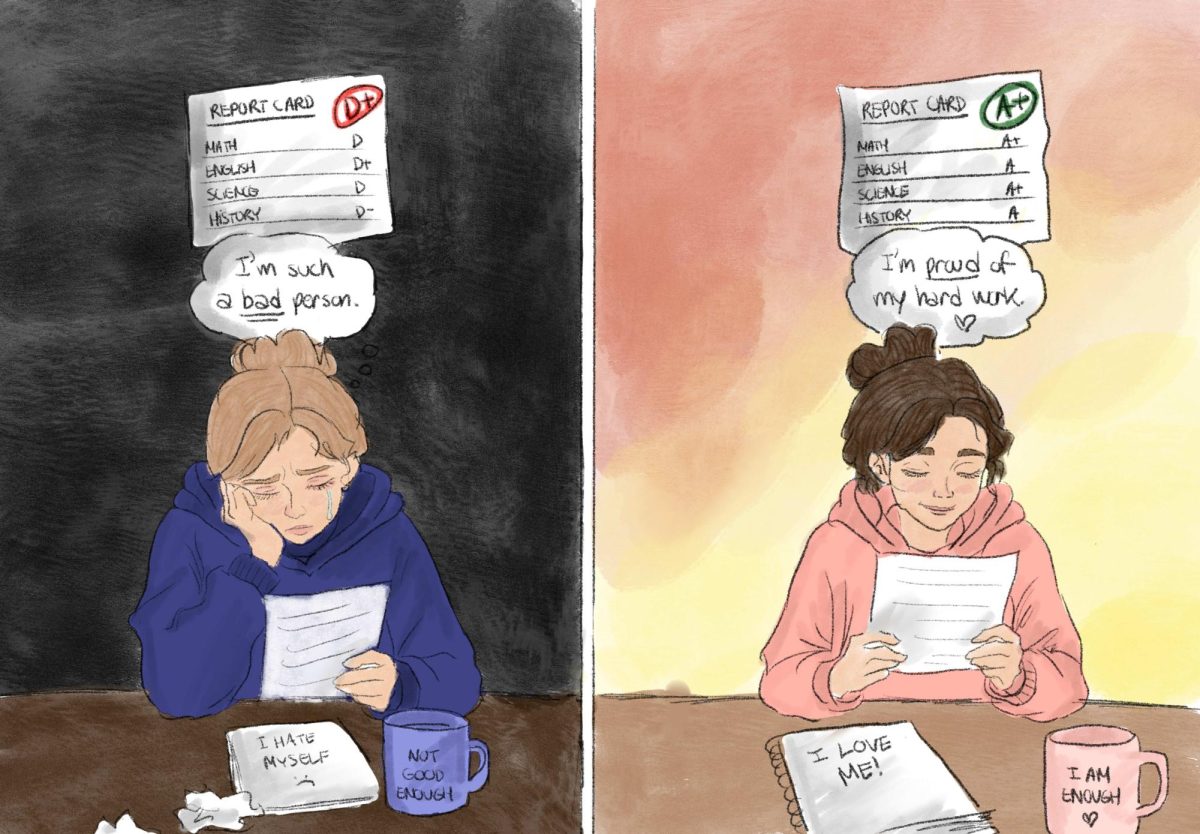
Subsequently, the structure of these charts can also influence how students perceive themselves within the classroom environment. Because participation is tracked visibly and connected to our grades, students may begin to associate their personal value with how frequently they contribute rather than the quality of what they contribute.
Although these charts are intended to encourage participation, they often transform classroom discussion into a public competition centered on quantity, reinforcing the idea that academic value is determined by how often students speak rather than the depth of their thought processes.
Students who participate less may feel as if they are lagging academically, while students with many marks may feel pressure to constantly maintain their status. Instead of fostering confidence and collaboration, the system risks encouraging comparison with peers by making a public display of everyone’s academic performance.
Some may argue that putting participation charts at the front of math classrooms does not affect the classroom environment and that this method is the most efficient way to measure students’ participation.
However, it’s unreasonable to think that students won’t consider how they appear in comparison to others when it is publicly visible.
To address the competitiveness curated by the participation charts in math classrooms instead of displaying charts that publicly compare how often students contribute, teachers could evaluate participation through private feedback, written reflections, group work, or self-assessments. This would still encourage classroom engagement while reducing the pressure that students feel to constantly compete with their peers.
By emphasizing the quality of a student’s personal growth rather than the number of recorded marks, the classroom environment could become more supportive and less competitive. These changes would allow participation to function as a tool for personal growth rather than a visible measure of a student’s performance.